Plotext allows us to approach to how we visualize data differently, compared to a package such as matplotlib, while keeping the syntax relatively the same.
Check out the graphs using a dataset that is found on the Space Weather Prediction’s Website using both Matplotlib and Plotext:

Matplotlib vs Plotext
» For the purposes of this, I’m not going to dive into the science behind what this graph is, but rather using it as a demonstration for the package.
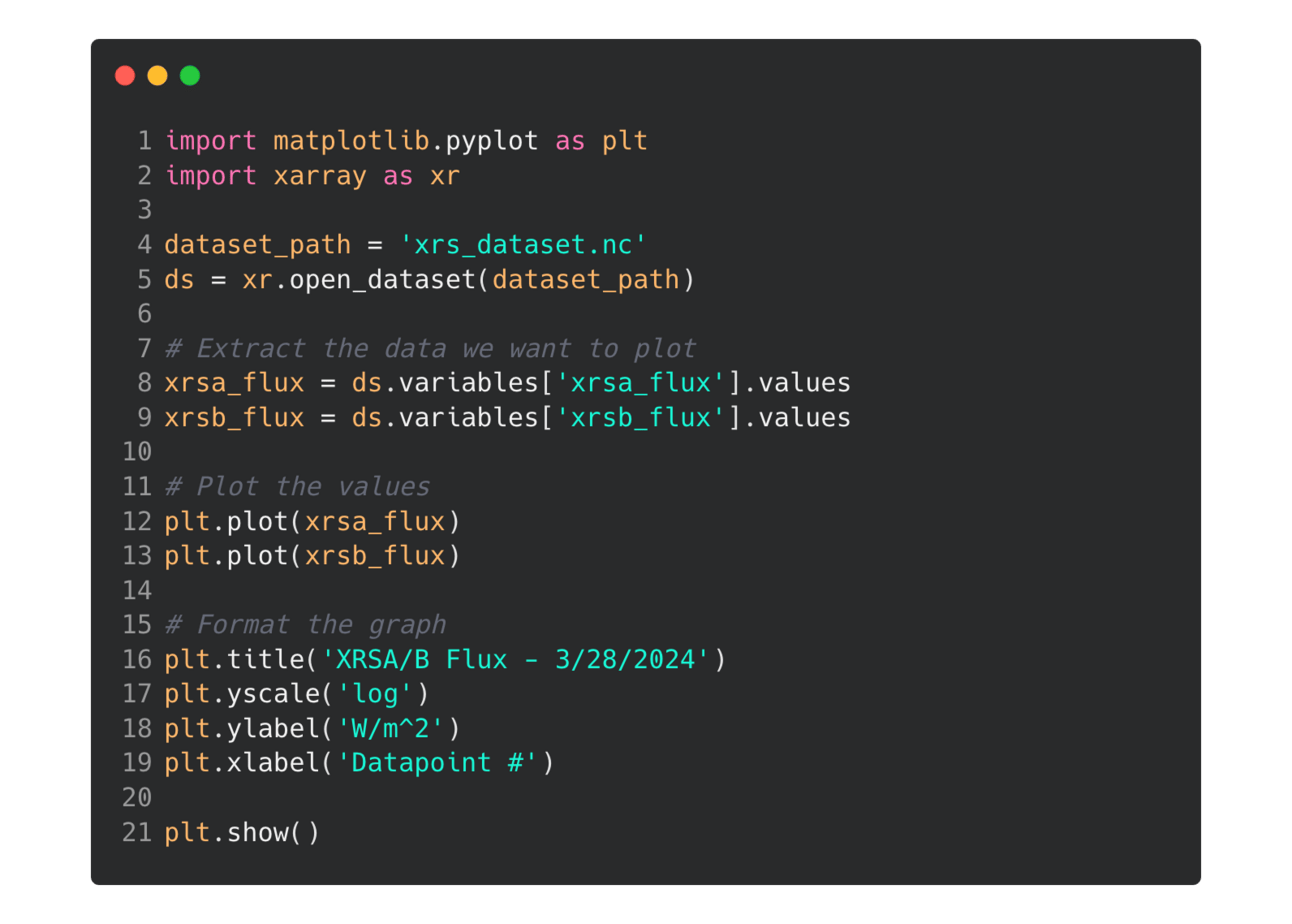
Here’s the code I used to achieve this graph in terminal:

Plotting using plotext
From a data visualization perspective, I want to point out a few differences between the graphs:
Matplotlib provides more of a granular view; we’re able to see more data.
At the peak just to the right of 1000 (on the x axis), you can’t see it peaking at 10-5 with plotext, but with matplotlib you can (for those space weather folks, that’s an M-class flare!).
Plotext doesn’t automatically put the y axis into scientific notation, making it hard to depict the actual values.
Article Contents
What is Plotext?
As you saw above, plotext is a library that allows us to easily plot in the terminal with nearly the same syntax as matplotlib. Here’s how I achieved the above plots using xarray to open the dataset:

Plotting using matplotlib
Just like matplotlib, you’re able to create a line or scatter plot, add plot labels (such as the title, x and y labels), create subplots, and even create a plot from matplotlib directly!
Differences: Matplotlib vs Plotext
I want to take a second to highlight some of the features by comparing it to a library you may already be familiar with: matplotlib. While terminal plotting is powerful, it does lack some capabilities other plotting libraries offer:
Feature | Plotext | Matplotlib |
|---|---|---|
Line Plots | ✅ | ✅ |
Scatter Plots | ✅ | ✅ |
Bar Charts | ✅ | ✅ |
Labels and Annotations | ✅ | ✅ |
Multiple Plots/Subplots | ✅ | ✅ |
Axes and Grid Customization | ✅ | ✅ |
Direct Terminal Plotting | ✅ | ❌ |
Streaming Plots | ✅ | ❌ |
3D Plotting | ❌ | ✅ |
Multiple Output Formats | ❌ | ✅ |
Advanced Plot Types | ❌ | ✅ |
LaTeX Integration | ❌ | ✅ |
» I also compared Plotly, Matplotlib, and Plotext in another article.
What are some use cases for Plotext?
Plotting in the terminal is relatively niche. It absolutely is not intended to be used for in-depth data exploration. Here’s a few use cases that I can think of:
Pairing it with SQL - Let’s suppose that you’re using SQL to do some exploratory analysis. If there’s some wonky values, you can use plotext to visualize this data in-terminal
Terminal-only Applications - The application I’m working on for work is terminal-only. Thus, visualizing complex scientific data sets is quite a challenge. Terminal plotting allows us to see these data sets when we need to perform spot checking and/or real-time analysis.
Snapshots of monitoring - If you have certain system resources you are monitoring (such as disk usage), you can do a spot check to get a snapshot as to what’s going on on disk, in memory, etc.
To get started with Plotext, visit the Github Repository and check out the documentation.
Happy plotting!
📧 Join the Python Snacks Newsletter! 🐍
Want even more Python-related content that’s useful? Here’s 3 reasons why you should subscribe the Python Snacks newsletter:
Get Ahead in Python with bite-sized Python tips and tricks delivered straight to your inbox, like the one above.
Exclusive Subscriber Perks: Receive a curated selection of up to 6 high-impact Python resources, tips, and exclusive insights with each email.
Get Smarter with Python in under 5 minutes. Your next Python breakthrough could just an email away.
You can unsubscribe at any time.
Interested in starting a newsletter or a blog?
Do you have a wealth of knowledge and insights to share with the world? Starting your own newsletter or blog is an excellent way to establish yourself as an authority in your field, connect with a like-minded community, and open up new opportunities.
If TikTok, Twitter, Facebook, or other social media platforms were to get banned, you’d lose all your followers. This is why you should start a newsletter: you own your audience.
This article may contain affiliate links. Affiliate links come at no cost to you and support the costs of this blog. Should you purchase a product/service from an affiliate link, it will come at no additional cost to you.

